Add drawings, text, and images to maps
Need to add your own information to the map, but are not a data or mapping expert? Drawing tools allow you to quickly add your own content such as preliminary damage and needs assessments, identification of staging areas, staffing and resources, areas and distances, and more. This section will equip you to do this, as well as walk you through how to export your custom drawings and share via Bookmarks.

|
|
 |
You can quickly access drawing tools from the right toolbar under the pan and zoom tools while the Drawing panel is open. Click and hold the button shown above to easily switch between tools. |
Add objects and shapes to the map
 |
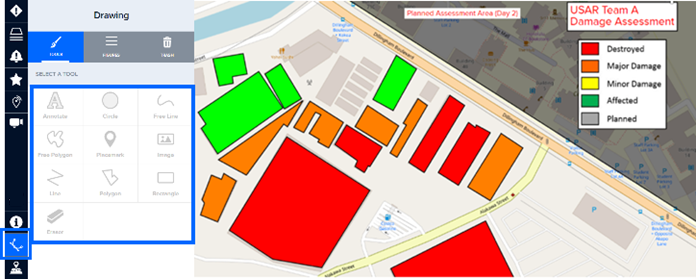
Click the Drawing icon on the left toolbar to view a list of different objects and shapes you can add to the map. Select a tool, then click on the map where to place it.
If using the Circle or Rectangle tool, click and drag to expand it. Other tools, such as Line and Polygon require a double-click on the map to complete the drawing. The Free Line and Free Polygon tools require you to click+ hold while moving your cursor to draw, releasing upon completion.
Your drawings will be listed under the Figures tab and will be automatically removed after your session has ended, unless bookmarked.
|
|
|
 |
You can create objects in outside programs like PowerPoint (such as the legend shown above) and import them with the Image tool. Under the imported images Style tab, select Scale with Map Zoom if you wish for the image to maintain its size in respect to the application screen. This is useful for imported icons, so they do not shrink or expand in size as you zoom out. |
Edit shape or object attributes
All tools include a set of attributes which can be accessed once a shape or object has been added to the map.
|
|
 |
Click the Figures tab in the Drawing panel then select the shape you want to edit or click an object you’ve added to the map to view its attributes in the drawing panel. |
Info allows users to label drawings, which helps you to quickly identify it in the Figures list. It also allows you to add critical details describing the drawings (e.g. damage classification, facility contact, field team status, etc.).
Border and Fill allow you to assign a color, as well as adjust transparency.

Measure distance and area with shapes
|
|
 |
Label allows you to display the drawings label (added under Info). For circles, polygons, rectangles and lines, this option also allows you to measure length and area. |
Add a circle, polygon, rectangle or line to the map. Click to edit object and then choose the Label tab in the drawing panel.
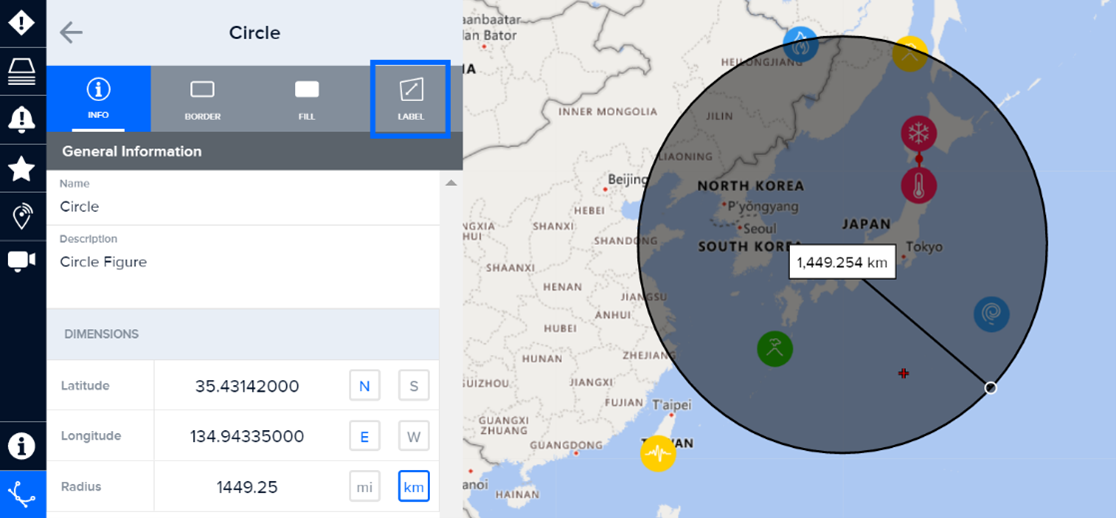
Toggle the attributes below to show the shape measurement and label, or to adjust other preferences like unit of measure, colors, and more.

|
|
 |
The Measurement Label feature is very useful for measuring the length of a runway in support of relief operations, as well as measuring open space (e.g. an open field) in support of mass care. |
Add place markers to the map
|
|
 |
With the Drawing panel open, click the Placemark tool and then click on the map to add. |
 |
Under the Placemark tab, choose from one of many different styles of place markers. Click the Info and Color tabs to adjust the name and color of the placemark. |
 |
You can also display the placemark’s name (Drawing Label) and coordinates on the map by enabling those options under the Label tab. |

**
**
Export or delete map drawings
 |
Click the Drawing icon from the left toolbar and then the Figures tab to change the attributes of a figure you’ve created or export your figures as a KML data file.
To export figures you’ve created, check the box next to the figures you wish to export and then the three dots at the top of the panel, followed by Export to KML. You can also delete figures by clicking the three dots and then Move All to Trash.
|

You can also remove drawings from the map by clicking the drawing with the Drawing panel open and selecting the Info tab, then the Move to Trash button.
Or, click the Eraser tool located in the Drawing panel and then click an object on the map to erase it.

Restore erased shapes and objects
While in the Drawing panel, click the Trash tab. You will see a list of figures you’ve deleted. Check the item you wish to restore and then the restore link. You can also empty the trash bin of all deleted objects from this menu.

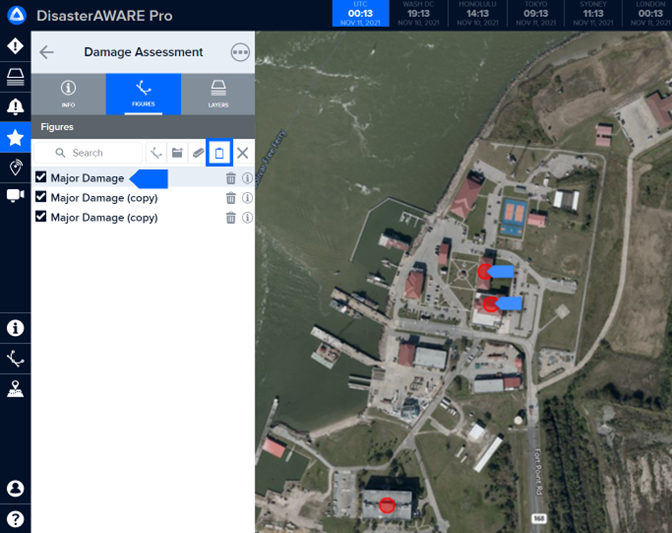
The Copy option is available for Bookmarks that include drawings and very useful when you need to recreate the same drawing multiple times, such as adding the same color dot to multiple structures on the imagery basemap, representing the same level of assessed damage.
First, open the Bookmarks panel and locate your bookmark that includes drawings. Then, select the information button to the right of that bookmark and click on the Features tab.

To copy, enable Edit mode and then click on the figure in the list you wish to copy. Click on the map to add a copy of that figure. Additional copies of that figure will appear on the map with each consecutive click until you deselect the Copy option.
